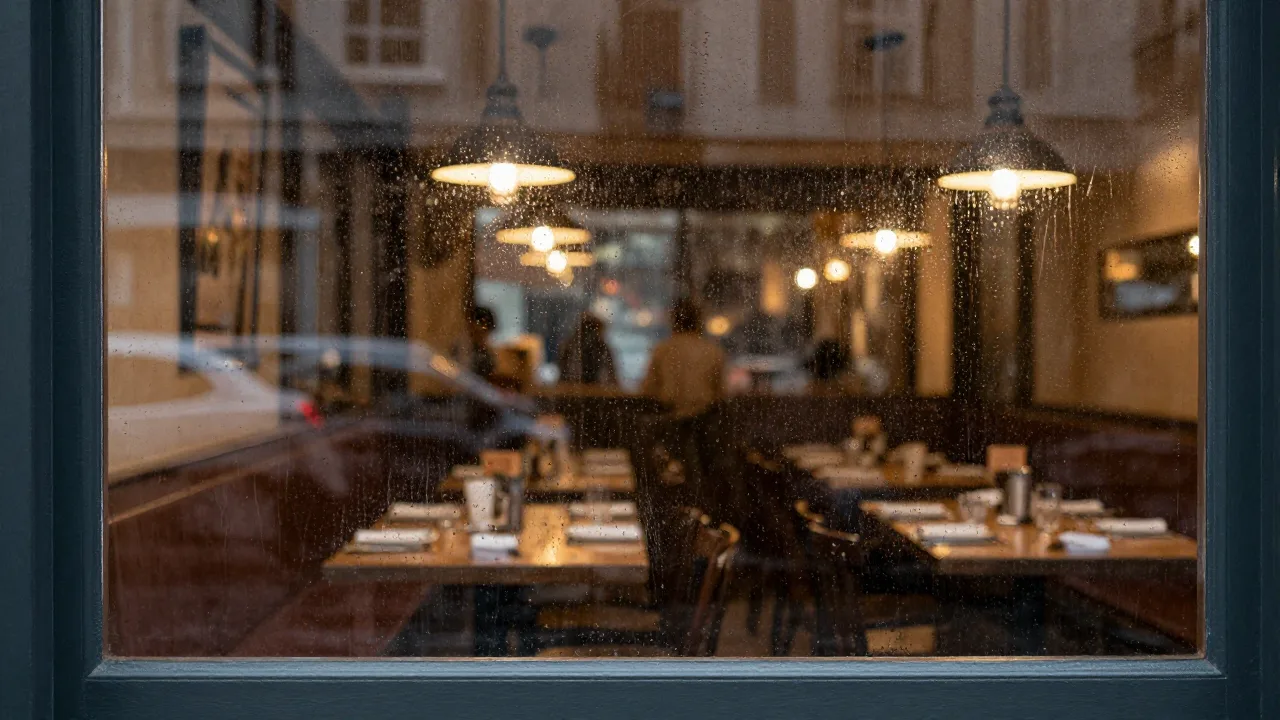
Two Tuesdays in May. Same menu, same staff, same marketing, no holiday on either side. The first did $6,840. The second did $4,190 — a 39% gap on days that should have been twins. Your schedule was built for the first one, so on the second you paid six people to watch an empty dining room and threw out 40 portions of prepped fish.
Ask any operator what happened and you get a shrug and the word "slow." That shrug is the problem. It treats a variable you can see three days in advance as though it were random, which means every rainy Tuesday costs you the same money as the last one, forever.
Weather is the largest predictable driver of daily variance that most restaurants never model. Not the only one — day of week and seasonality dwarf it — but those are already in your head. Weather is the piece that explains why this Tuesday was not like that Tuesday, and unlike a competitor's promotion or a local event, it comes with a free three-day forecast attached.
What follows is how to build the model without a data science hire: which variables actually matter, how to join weather to your POS history, and how to turn the coefficients into prep and staffing decisions that hold up on a Friday.
The Variables That Move Covers — and the Ones That Don't
Operators who try this usually start by pulling daily high temperature and total rainfall. Both are the wrong shape, and that is why the first attempt so often shows "no relationship."
Precipitation timing beats precipitation totals
An inch of rain that falls between 3 a.m. and 6 a.m. has almost no effect on your dinner service. A tenth of an inch falling between 5:30 and 7:00 p.m. can cost you a fifth of your covers. The variable that carries signal is precipitation in the two hours immediately before and during a service window, not the daily total. Model lunch and dinner separately for the same reason.
Temperature matters as deviation, not as a number
Sixty-two degrees in March is a gift; sixty-two in September is disappointing. Guests respond to how conditions compare with what they expected for the season, so the useful variable is degrees above or below the 30-year normal for that date, not the raw reading. Most concepts show a rough inverted-U: sales rise as you approach a comfortable band and fall off at both extremes, with the peak typically somewhere between 68°F and 78°F for patio-capable restaurants.
Wind is a patio variable
Sustained wind above roughly 15 mph makes outdoor seating unpleasant regardless of temperature. If a meaningful share of your capacity is outside, wind belongs in the model. If you have no patio, it is noise — drop it and keep the model simple.
Severe weather is a switch, not a slope
A winter storm warning, a hurricane watch, or a heat advisory does not scale gradually. Behavior changes discontinuously the moment the alert is issued, often before any weather arrives. Model these as binary flags, and be honest that a handful of extreme days should simply be excluded from your training data as outliers rather than allowed to warp coefficients for the other 350.
| Variable | Right form | Typical effect |
|---|---|---|
| Precipitation | Inches in the 2 hrs before service | Strongest single predictor; suppresses walk-in |
| Temperature | Deviation from seasonal normal | Inverted-U; peak near 68–78°F |
| Wind | Sustained mph during service | Patio only; sharp threshold near 15 mph |
| Severe alerts | Binary flag | Step change, often ahead of the event |
| Daylight | Sunset time relative to service | Matters for early dinner in winter |
A weather model is only worth building if it reaches the schedule and the prep list. KwickView joins forecast data to your own sales history and shows the adjusted expectation for each daypart.
See how KwickOS forecasts demand →Building the Model in Seven Steps
Two years of daily history and a spreadsheet are enough to get most of the available value. Here is the sequence.
- Export daily and daypart sales for 24 months. Net sales and guest counts, split at minimum into lunch and dinner. Guest counts are the better dependent variable because they are not contaminated by price increases.
- Pull matching historical weather. NOAA's Climate Data Online archive is free and covers most U.S. stations; commercial weather APIs offer cleaner hourly data for a modest fee. Use the station closest to your restaurant, not the regional airport 30 miles out, if you have the choice.
- Join on date and service window. Aggregate hourly weather into the two-hour pre-service window for each daypart. This join is the fiddly part and the part that determines whether the model works.
- Control for the big drivers first. Add day-of-week and month indicators before you touch weather. Without them, weather will absorb seasonality and you will conclude that cold weather causes December.
- Tag and remove known anomalies. Holidays, local events, closures, private buyouts, the week your hood system failed. Roughly 5–8% of days in a typical two-year window need flagging, and leaving them in does more damage than any modeling choice you will make.
- Run the regression and read the coefficients as dollars. A coefficient of −0.19 on the rain indicator means a rainy dinner runs 19% below an otherwise identical dry one. Translate every coefficient into covers and dollars immediately — nobody schedules off a beta value.
- Validate on data the model never saw. Train on the first 20 months, test on the last 4. Compare the model's mean absolute error against your current forecast's. If it does not beat the status quo, you have an interesting spreadsheet and nothing more.
Step seven is where honesty lives. A model that fits history beautifully and predicts next Thursday no better than your gut is a common and expensive outcome. The point of the holdout test is to find that out in an afternoon rather than after a quarter of bad schedules. If you already run structured restaurant sales forecasting, the weather layer should measurably reduce error on top of it or it does not belong.
Tomas Lindqvist operates a 110-seat seafood restaurant with a 40-seat patio in Charleston, SC. Patio capacity was 27% of his seats and the single biggest source of forecast error. "Every manager had a theory about rain. None of them agreed and all of them were confident."
He joined 26 months of daypart sales to hourly NOAA data. Once weekday and month were controlled for, the numbers were unambiguous: rain in the 5–7 p.m. window cut dinner covers 21%, sustained wind above 15 mph cut them 12% even on dry evenings, and temperature deviation showed the expected inverted-U peaking around 74°F.
The finding nobody predicted was the split by channel. On wet evenings dine-in fell 21% while takeout rose 34%, leaving total revenue down only 9%. "We'd been cutting the whole crew on rainy nights, including the person who should have been expediting to-go. We were creating the second problem ourselves."
He moved to weather-adjusted staffing inside a 72-hour window: fewer servers, one more expo, and a prep list scaled to the adjusted forecast. Over the following two quarters food waste on rainy weeks fell 31% and labor as a percentage of sales improved 1.4 points, worth roughly $34,000 annualized.
Turning Coefficients Into Decisions
A model that lives in a spreadsheet changes nothing. Three places where a weather-adjusted forecast pays for itself:
- Prep quantities. The most direct win. If Thursday's adjusted forecast is 18% below the seasonal baseline, prep 18% less of the perishable items and you avoid a waste event without risking an 86. Waste from over-prepping on weather-suppressed days is one of the largest recoverable line items most kitchens have — the same territory covered by waste tracking analytics.
- Call-in and cut decisions. Schedules are published two weeks out, well past forecast reliability. Use the base schedule for planning and weather for the final 48–72 hours: an on-call server who gets a text at noon, or an early cut that everyone understands is coming when the forecast turns. Pair it with peak-hour staffing data so cuts land on the right positions and not just the last person hired.
- Channel rebalancing. The Charleston finding generalizes. Rain moves demand rather than only destroying it, so a wet forecast is a signal to shift labor toward off-premise and to time a delivery promotion for the exact evening when intent is already there.
What ties these together is a habit, not a technology: check the adjusted forecast at the same moment every day, before prep lists and call-ins are decided. A model consulted after those decisions are made is decoration.
Four Ways Weather Models Go Wrong
- Weather absorbs seasonality. Skip the month controls and the model concludes that cold weather causes your slow February, when the real cause is the calendar. Always control for the obvious before testing the subtle.
- One model for all channels. Dine-in falls, delivery rises, and a combined model shows a weak, muddy effect. Split the dependent variable by channel and both signals get sharp.
- Overfitting on two years. Twenty-four months contains maybe fifteen genuinely stormy dinner services. A model with twelve weather variables will fit those fifteen days perfectly and generalize terribly. Keep it to four or five variables until you have four years of history.
- Forecast error treated as certainty. A 60% chance of rain is not rain. Weight the adjustment by forecast probability rather than flipping a switch, and accept that beyond 72 hours the weather input is close to worthless.
That last discipline separates operators who trust the model from those who abandon it after one wrong call. Building probability weighting in from the start makes the occasional miss a rounding error instead of a credibility event, and it is standard practice in broader predictive analytics for restaurants.
Where This Goes Next
Everything above is achievable with a regression and free NOAA data, and for most independents that is the right stopping point. The step beyond it is letting a model consume weather alongside local events, school calendars, competitor activity, and your own promotion history — which is where AI-driven demand forecasting starts to beat handcrafted regressions, because interaction effects between those inputs are exactly what a human-specified model misses.
Either way the raw material is your own sales history, and the practical obstacle has always been the join: matching hourly weather to daypart sales, refreshing it, and getting the result in front of whoever writes the prep list. KwickView handles that plumbing on top of your KwickOS POS, showing a weather-adjusted expectation per daypart next to the seasonal baseline so the adjustment is visible where the decision gets made rather than buried in a monthly revenue forecasting model nobody opens on a Tuesday.
Frequently Asked Questions
How much does weather actually affect restaurant sales?
The effect varies enormously by concept and geography, but restaurants that build a model typically find weather explains somewhere between 10% and 30% of day-to-day sales variance once day of week and seasonality are accounted for. Patio-heavy and walk-up concepts sit at the high end because their capacity itself depends on conditions, while destination restaurants with reservations sit at the low end because guests committed days earlier.
Which weather variables matter most for restaurant demand?
Precipitation during the two hours before a service period is usually the single strongest predictor, ahead of daily rainfall totals. Temperature matters as a deviation from the seasonal norm rather than an absolute, so 62°F feels different in March than in September. Wind speed matters mainly for patios, and severe weather alerts act as a separate switch rather than a gradual effect.
Do I need machine learning to build a weather demand model?
No. A simple multiple regression on two years of daily data with day of week, month, precipitation, and temperature deviation captures most of the available signal, and many operators get useful results from a plain lookup table of average sales by weather bucket and weekday. Machine learning helps when you have several years of data across multiple locations and want interaction effects, but it is not the entry point.
How far ahead can a weather-adjusted forecast be trusted?
Forecast accuracy for precipitation drops sharply past about 72 hours, so weather adjustments are most reliable inside a three-day window. That is a reasonable fit for prep and ordering decisions but awkward for schedules published two weeks out. The practical answer is to build the base schedule from seasonal patterns and use weather signals for call-in, cut, and prep adjustments in the final 48 to 72 hours.
Does bad weather always reduce restaurant sales?
No, and assuming so is a common modeling mistake. Rain reliably suppresses walk-in and patio traffic while often lifting delivery and pickup orders, so a restaurant with a strong off-premise channel can see total revenue hold steady or rise on a wet evening even as dine-in covers fall. Extreme heat pushes guests indoors toward air-conditioned dining rooms and shifts beverage mix. Model each channel separately or the offsetting effects will cancel out and make weather look irrelevant.
Rainy Tuesdays do not have to cost the same money every time. Put a weather-adjusted forecast in front of whoever writes the prep list.
Learn more about KwickOS forecasting →KwickOS Ecosystem
© 2024-2026 KwickOS. All rights reserved.